<aside> ⬇️ Link to copy the dashboard to your account
</aside>
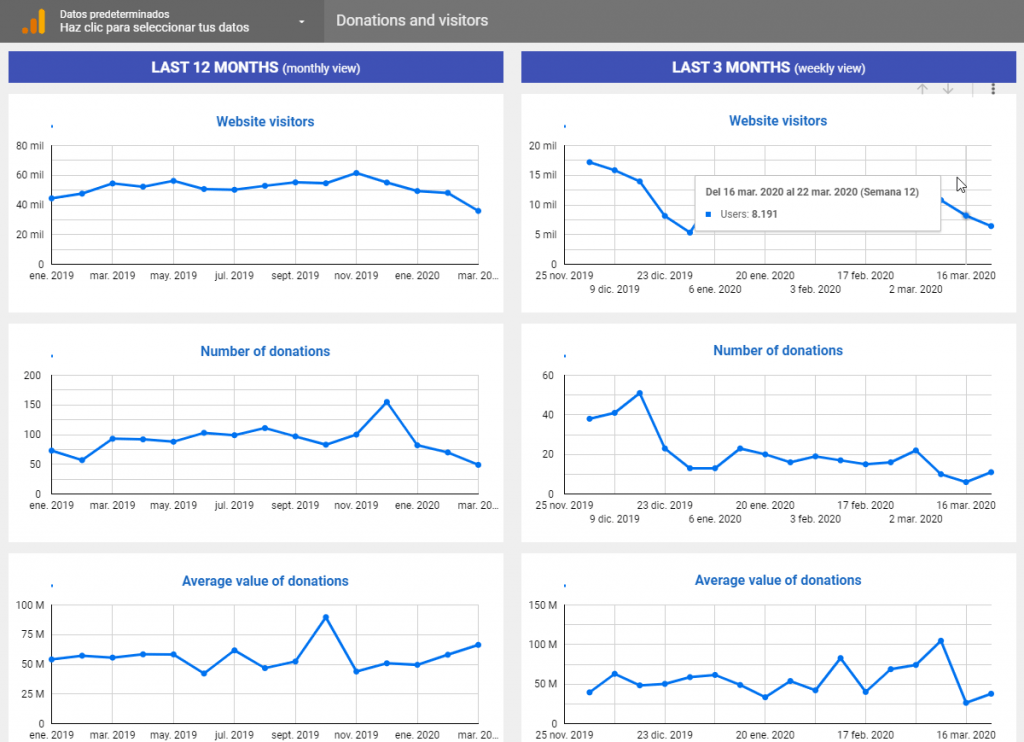
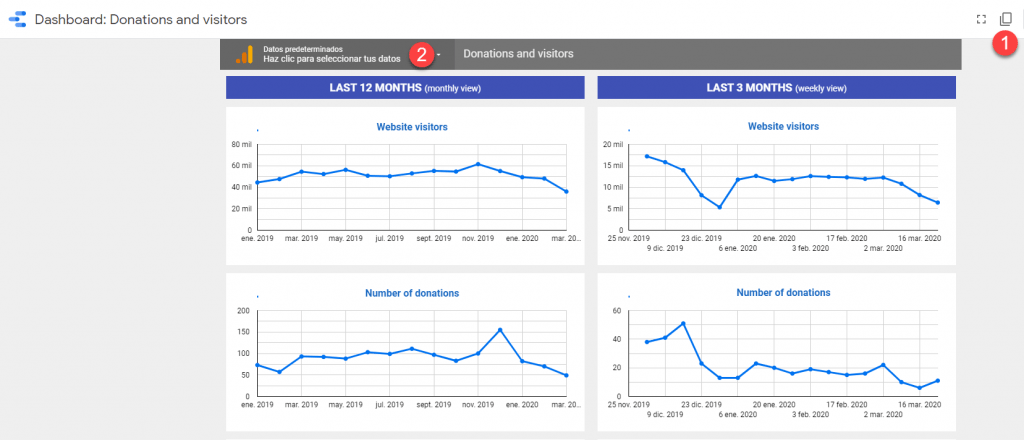
This dashboard shows the evolution of key metrics such as visitors, total donations, average donation and donation per visitor.

We recommend you create a copy and customize it with your metrics (and also with the colors and logo of your organization if you want). Once you choose the Google Analytics view of your website, this report will be updated automatically with the latest available data, without you having to do anything else.
